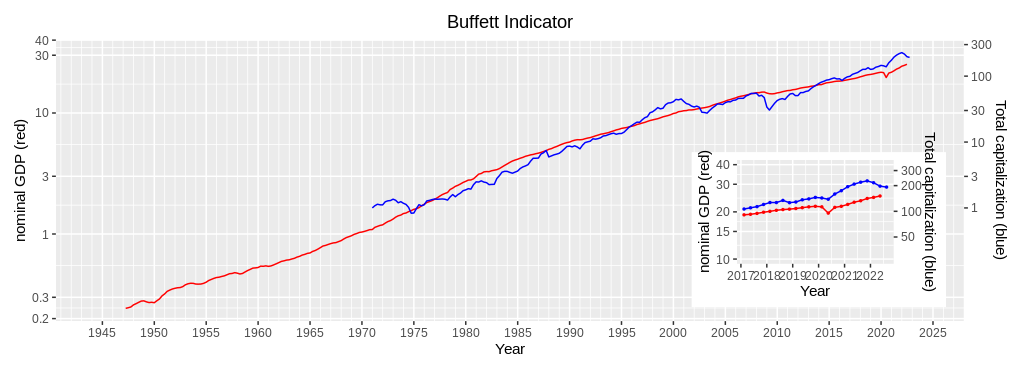
Updated graph of Buffett Indicator (3rd quarter, 2022)
We apdated the the graph of the Buffett Indicator. The Wishire 5000 index dropped from the second quarter of 2022 by a couple of percent. Contrary to Japan, The US stock market has kept shrinking this year. The gap between the observed value and the fitted value of Wilshire5000 Index has deflated by half in the last one year and keeps deflating.

| Year | Quarter | Nominal GDP (red, left scale) | Wilshire5000 Index Quarterly mean (blue, right scale) | Wilshire5000 Index Fitted value (red, right scasle) | Wilshire5000 Index Q.mean÷F.value |
| 2021 | 1st | 22,038 | 194.3 | 118.1 | 1.645 |
| 2nd | 22,741 | 208.4 | 125.1 | 1.666 | |
| 3rd | 23,202 | 219.5 | 129.8 | 1.691 | |
| 4th | 24,003 | 227.4 | 138.1 | 1.647 | |
| 2022 | 1st | 24,367 | 216.2 | 142.2 | 1.520 |
| 2nd | 24,852 | 197.2 | 147.2 | 1.340 | |
| 3rd | N/A | 192.3 | N/A | N/A |

