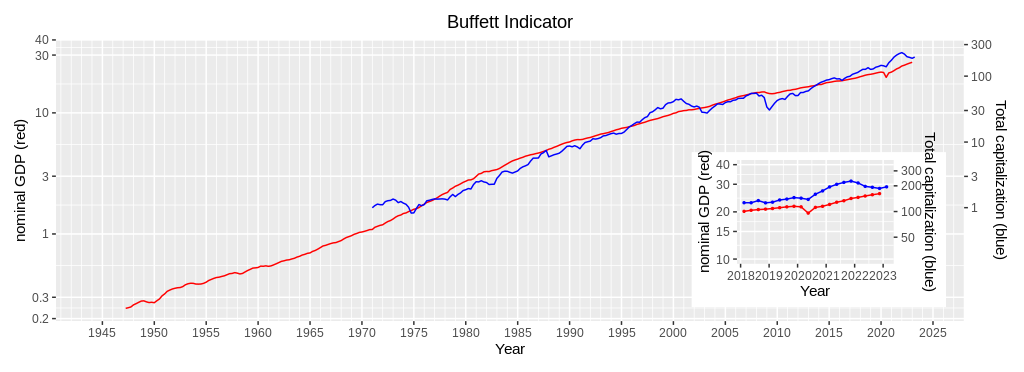
Updated Graph of Buffett Indicator (1st quarter, 2023)
We have updated the graph of the Buffett Indicator for the Wilshire 5000 Index and nominal GDP. The indicator, which is the ratio of the observed value of the index to the fitted value based on nominal GDP, reached its peak during the 3rd quarter of 2021. Since then the indicator had continuously declined till the 4th quarter of 2022. However, the indicator seems to rebound during the 1st quarter of 2023. The index has risen by 4.3% relative to the previous quarter, but nominal GDP is unlikely to rise at such a high rate.

| Year | Quarter | Nominal GDP (red, left scale) | Wilshire5000 Index Quarterly mean (blue, right scale) | Wilshire5000 Index Fitted value (red, right scasle) | Wilshire5000 Index Q.mean÷F.value |
| 2021 | 1st | 22,314 | 194.3 | 121.1 | 1.605 |
| 2nd | 23,047 | 208.4 | 128.5 | 1.622 | |
| 3rd | 23,550 | 219.5 | 133.7 | 1.642 | |
| 4th | 24,349 | 227.4 | 142.2 | 1.599 | |
| 2022 | 1st | 24,740 | 216.2 | 146.4 | 1.477 |
| 2nd | 25,248 | 197.2 | 152.0 | 1.298 | |
| 3rd | 25,724 | 192.3 | 157.3 | 1.222 | |
| 4th | 26,145 | 186.5 | 162.1 | 1.151 | |
| 2023 | 1st | N/A | 194.6 | N/A | N/A |
このサイトのコンテンツは過去の実績をもとにした個人的な分析・意見であり、将来の成果等を保証するものではありません。資産運用は自己責任でお願いします。

