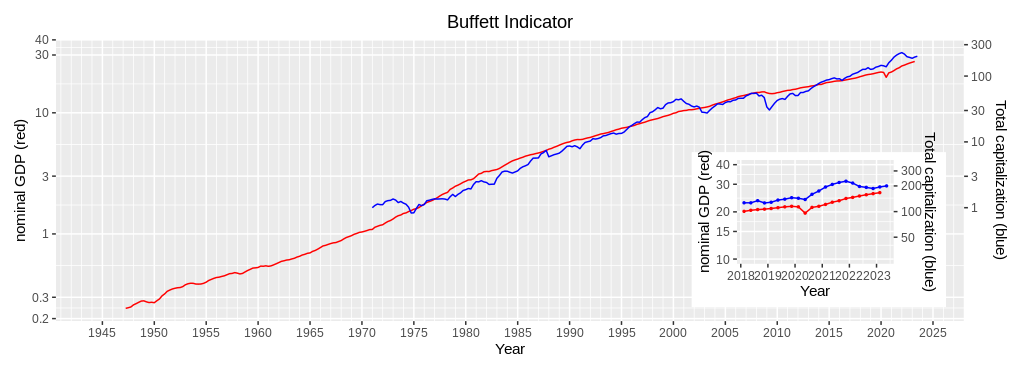
Updated Graph of Buffett Indicator (2nd quarter, 2023)
This page updates the graph of the Buffett Indicator for the 2nd quarter of 2023. The Buffett Indicator of this site is the ratio of Wilshire 5000 stock price index to nominal GDP. The indicator has been decreasing from 1.638 in the 3rd quarter 2021 to 1.166 in the 1st quarter 2023. The indicator seems to remain at the same level for the 2nd quarter. (Caution: the date source of this site, FRED, does not provide the Wilshire 5000 date for June, 2023.)

| Year | Quarter | Nominal GDP (red, left scale) | Wilshire5000 Index Quarterly mean (blue, right scale) | Wilshire5000 Index Fitted value (red, right scasle) | Wilshire5000 Index Q.mean÷F.value |
| 2021 | 1st | 22,314 | 194.3 | 121.1 | 1.601 |
| 2nd | 23,047 | 208.4 | 128.5 | 1.618 | |
| 3rd | 23,550 | 219.5 | 133.7 | 1.638 | |
| 4th | 24,349 | 227.4 | 142.2 | 1.595 | |
| 2022 | 1st | 24,740 | 216.2 | 146.4 | 1.473 |
| 2nd | 25,248 | 197.2 | 152.0 | 1.295 | |
| 3rd | 25,724 | 192.3 | 157.3 | 1.220 | |
| 4th | 26,138 | 186.5 | 162.4 | 1.149 | |
| 2023 | 1st | 26,530 | 194.6 | 166.9 | 1.166 |
| 2nd | N/A | 200.1 | N/A | N/A |
このサイトのコンテンツは過去の実績をもとにした個人的な分析・意見であり、将来の成果等を保証するものではありません。資産運用は自己責任でお願いします。

