Report on Buffett Indicator (3rd Quarter, 2023)
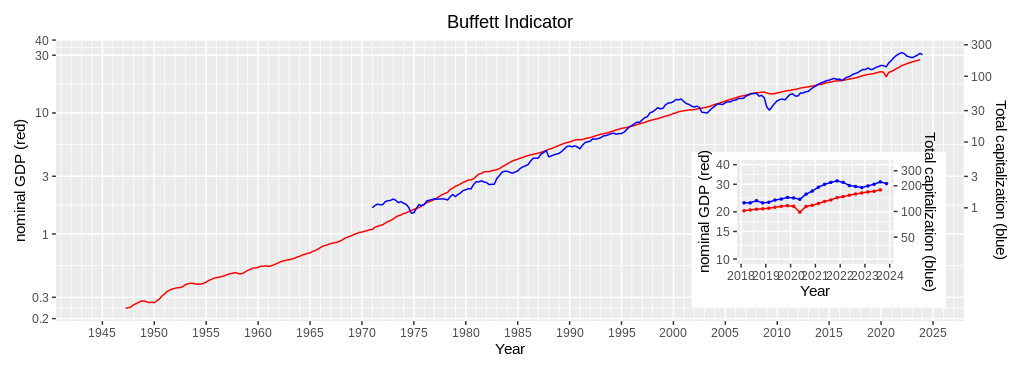
This page demonstrates the updated graph and table of the Buffett Indicator of the US total stock markets. Last week, the latest US GDP data was published. Real GDP increased at an annual rate of 4.9%, and nominal GDP increased at 8.5%. The data indicates that the US economy was in good shape, although inflation remained strong. On the other hand, the Wilshire 5000 decreased at a quarterly rate of 6.6%. Thus, the Buffett Indicator increased from 1.209 to 1.241 during the 3rd quarter of 2023. Now, the FED seems terminating its monetary policy. The Buffett Indicator might make an upward turn in the coming months.

| Year | Quarter | Nominal GDP (red, left scale) | Wilshire5000 Index Quarterly mean (blue, right scale) | Wilshire5000 Index Fitted value (red, right scale) | Wilshire5000 Index Q.mean÷F.value |
| 2021 | 1st | 22,600 | 192.7 | 123.8 | 1.557 |
| 2nd | 23,292 | 207.9 | 130.8 | 1.589 | |
| 3rd | 23,829 | 219.3 | 136.4 | 1.608 | |
| 4th | 24,655 | 228.2 | 145.3 | 1.571 | |
| 2022 | 1st | 25,029 | 219.6 | 149.3 | 1.470 |
| 2nd | 25,544 | 201.2 | 155.0 | 1.299 | |
| 3rd | 25,995 | 196.5 | 160.1 | 1.227 | |
| 4th | 26,408 | 190.8 | 164.8 | 1.157 | |
| 2023 | 1st | 26,814 | 199.2 | 169.5 | 1.175 |
| 2nd | 27,063 | 208.5 | 172.4 | 1.209 | |
| 3rd | 27,624 | 222.3 | 179.1 | 1.241 | |
| October | N/A | 212.3 | N/A | N/A |

