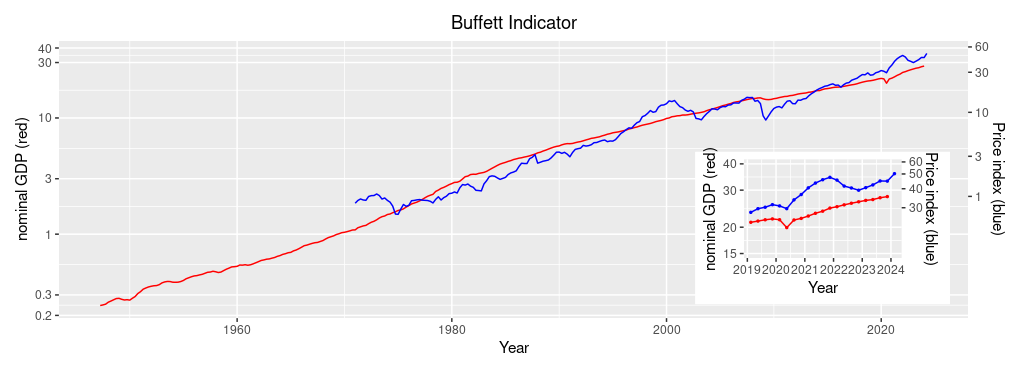
Updated Graph of Buffett Indicator (1st quarter, 2024)
This page shows the updated graph of the Buffett Indicator up to the first quarter of 2024. The stock price index is now changed to the Wilshire 5000 Price Index from the Wilshire 5000 Total Market Capitalization. The difference is dividends; the former does not include dividends but the latter does include.
The Buffett Indicator (the left-most column of the table below) peaked in the third quarter of 2021. Since the index went down until the last quarter of 2023. However, the Price index showed a large upswing in the first quarter of 2024. The site manager expects the Buffett Indicator to jump up in the first quarter of 2024.

| Year | Quarter | Nominal GDP (red, left scale) | Wilshire5000 Index Quarterly mean (blue, right scale) | Wilshire5000 Index Fitted value (red, right scasle) | Wilshire5000 Index Q.mean÷F.value |
| 2021 | 1st | 22,600 | 40,525 | 26,467 | 1.531 |
| 2nd | 23,292 | 43,581 | 27,594 | 1.579 | |
| 3rd | 23,829 | 45,026 | 28,476 | 1.609 | |
| 4th | 24,655 | 47,519 | 29,849 | 1.592 | |
| 2022 | 1st | 25,029 | 45,565 | 30,478 | 1.495 |
| 2nd | 25,544 | 41,627 | 31,348 | 1.328 | |
| 3rd | 25,995 | 40,448 | 32,115 | 1.259 | |
| 4th | 26,408 | 39,099 | 32,823 | 1.191 | |
| 2023 | 1st | 26,814 | 40,640 | 33,522 | 1.212 |
| 2nd | 27,063 | 42,370 | 33,964 | 1.248 | |
| 3rd | 27,610 | 44,978 | 34,906 | 1.289 | |
| 4th | 27.957 | 44,870 | 35,514 | 1.263 | |
| 2024 | 1st | N/A | 50,233 | N/A | N/A |

