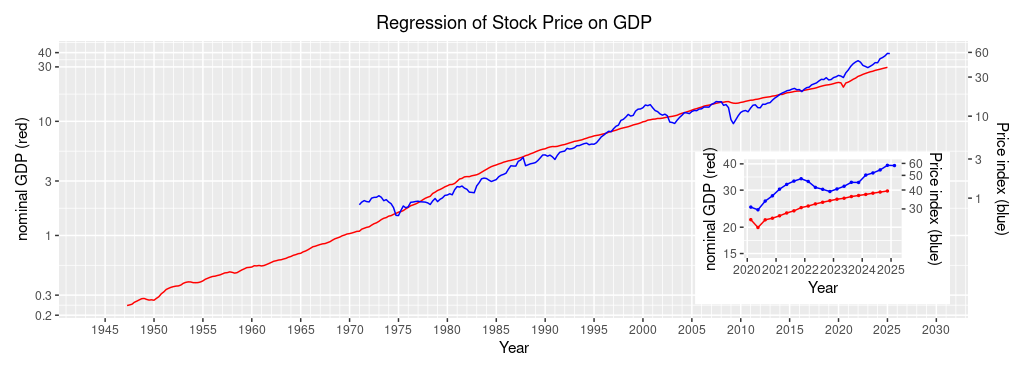
Updated Graph of Buffett Indicator (1st quarter, 2025)
This page presents the updated graph of the Buffett Indicator for the US stock markets. Trump disturbances are hitting not only the US stock markets but also the world economy. The Wilshire 5000 Price Index was down by 0.4% from the fourth quarter of 2024. Now, there are rumors that the US economy is going into a recession. The US GDP for the first quarter of 2025 will be published in mid-May. Let’s see what happens in the US economy.

| Year | Quarter | Nominal GDP (red, left scale) | Wilshire 5000 Price Index Quarterly mean (blue, right scale) | Wilshire 5000 Price Index Fitted value (red, right scale) | Wilshire 5000 Price Index Quarterly mean / Fitted value |
| 2021 | 1st | 22,657 | 40,525 | 27,009 | 1.500 |
| 2nd | 23,369 | 43,581 | 28,198 | 1.546 | |
| 3rd | 23,922 | 45,026 | 29,132 | 1.573 | |
| 4th | 24,777 | 47,519 | 30,592 | 1.553 | |
| 2022 | 1st | 25,215 | 45,565 | 31,348 | 1.454 |
| 2nd | 25,806 | 41,627 | 32,375 | 1.286 | |
| 3rd | 26,272 | 40,448 | 33,192 | 1.219 | |
| 4th | 26,734 | 39,099 | 34,008 | 1.150 | |
| 2023 | 1st | 27,164 | 40,640 | 34,773 | 1.169 |
| 2nd | 27,454 | 42,370 | 35,290 | 1.201 | |
| 3rd | 27,968 | 44,978 | 36,213 | 1.242 | |
| 4th | 28,297 | 44,870 | 36,808 | 1.219 | |
| 2024 | 1st | 28,624 | 50,233 | 37,402 | 1.343 |
| 2nd | 29,017 | 51,877 | 37,118 | 1.361 | |
| 3rd | 29,735 | 54,340 | 38,775 | 1.401 | |
| 4th | 29,724 | 58,277 | 39,418 | 1.478 | |
| 2025 | 1st | N/A | 58,061 | N/A | N/A |

