
Report on Buffett Indicator (1st Quarter, 2025)
New US GDP data has been recently published. US nominal GDP grew by 0.9% from the 4th quarter of 2024, but US real GDP dropped by 0.3% from the previous quarter. It could signal a recession. At the same time, the Wilshire 5000 index fell by 0.3% for the same period. As a result, the Buffett Indicator (the right-most column of the table below) decreased by 0.023. This drop reflected uncertainties caused by US President Trump.
Coincidentally, Warren Buffett just announced his retirement this year. His article inspired this study. Also, coincidentally, this site just uploaded a new paper (https://has4er.tokyo/us-site/us_buffett_indicator_05012025). Please take a look.
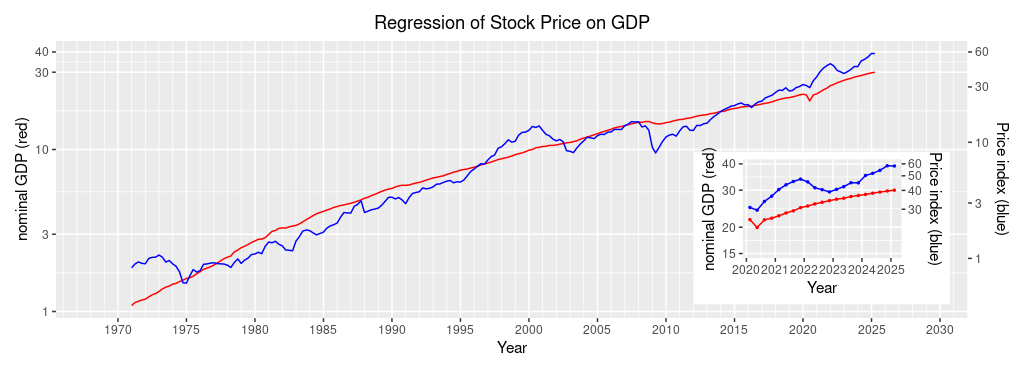
| Year | Quarter | Nominal GDP (red, left scale) | Wilshire5000 Index Quarterly mean (blue, right scale) | Wilshire5000 Index Fitted value (red, right scale) | Wilshire5000 Index Q.mean÷F.value |
| 2021 | 1st | 22,657 | 40,525 | 27,143 | 1.493 |
| 2nd | 23,369 | 43,581 | 28,341 | 1.538 | |
| 3rd | 23,922 | 45,026 | 29,281 | 1.565 | |
| 4th | 24,777 | 47,519 | 30,752 | 1.545 | |
| 2022 | 1st | 25,215 | 45,565 | 31,514 | 1.446 |
| 2nd | 25,806 | 41,627 | 32,548 | 1.279 | |
| 3rd | 26,272 | 40,448 | 33,372 | 1.212 | |
| 4th | 26,734 | 39,099 | 34,194 | 1.143 | |
| 2023 | 1st | 27,164 | 40,640 | 34,964 | 1.162 |
| 2nd | 27,454 | 42,370 | 35,485 | 1.194 | |
| 3rd | 27,968 | 44,978 | 36,415 | 1.235 | |
| 4th | 28,297 | 44,870 | 37,015 | 1.212 | |
| 2024 | 1st | 28,624 | 50,233 | 37,613 | 1.336 |
| 2nd | 29,017 | 51,877 | 38,335 | 1.353 | |
| 3rd | 29,375 | 54,340 | 38,997 | 1.393 | |
| 4th | 29,724 | 58,277 | 39,645 | 1.470 | |
| 2025 | 1st | 29,978 | 58,061 | 40,118 | 1.447 |