
Updated Graph of U.S. Buffett Indicator (3rd quarter, 2025)
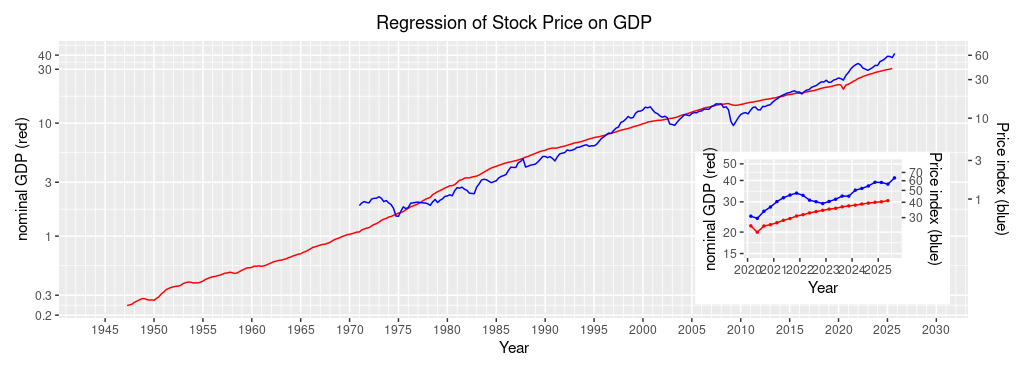
This page presents the updated graph of the Buffett Indicator for the US stock markets. The stock price of the AI industry has increased, and the Wilshire 5000 has increased by 12.5% since the previous quarter. The last quarter’s drop in the Wilshire 5000 resulted from the Trump tariffs, but it recovered within one quarter.
| Year | Quarter | Nominal GDP (red, left scale) | Wilshire 5000 Price Index Quarterly mean (blue, right scale) | Wilshire 5000 Price Index Fitted value (red, right scale) | Wilshire 5000 Price Index Quarterly mean / Fitted value |
| 2021 | 1st | 22,681 | 40,525 | 27,274 | 1.49 |
| 2nd | 23,426 | 43,581 | 28,535 | 1.53 | |
| 3rd | 23,982 | 45,826 | 29,487 | 1.55 | |
| 4th | 24,814 | 47,519 | 30,925 | 1.54 | |
| 2022 | 1st | 25,250 | 45,565 | 31,688 | 1.44 |
| 2nd | 25,861 | 41,627 | 32,764 | 1.27 | |
| 3rd | 26,336 | 40,448 | 33,608 | 1.20 | |
| 4th | 26,771 | 39,099 | 34,385 | 1.14 | |
| 2023 | 1st | 27,216 | 40640 | 35,188 | 1.15 |
| 2nd | 27,530 | 42,370 | 35,756 | 1.18 | |
| 3rd | 28,075 | 44,978 | 36,749 | 1.22 | |
| 4th | 28,425 | 44,870 | 37,390 | 1.20 | |
| 2024 | 1st | 28,708 | 50,233 | 37,913 | 1.32 |
| 2nd | 29,147 | 51,877 | 38,725 | 1.34 | |
| 3rd | 29,512 | 54,340 | 39,404 | 1.38 | |
| 4th | 29,825 | 58,277 | 39,990 | 1.46 | |
| 2025 | 1st | 30,042 | 58,061 | 40,397 | 1.44 |
| 2nd | 30,486 | 56,231 | 41,233 | 1.36 | |
| 3rd | N/A | 63,253 | N/A | N/A |