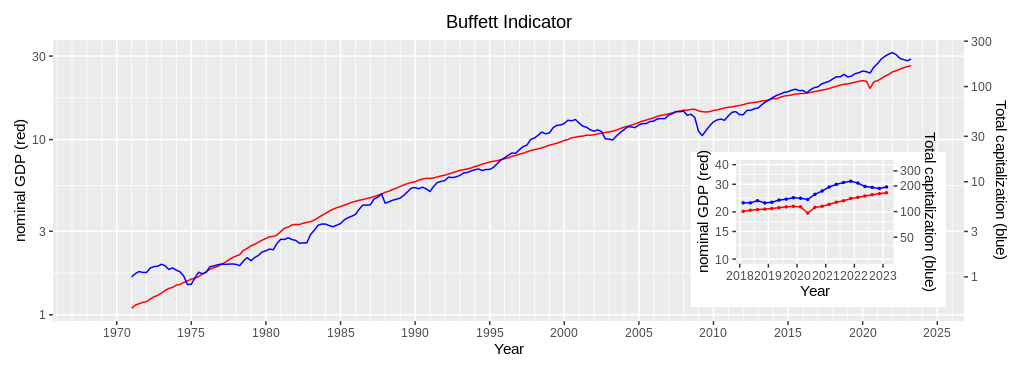
Report on Buffett Indicator (1st quarter, 2023)
This page reports the Buffett Indicator up to the 1st quarter of 2023. This site regards the ratio of the observed value to the fitted value of Wilshire 5000 Index as the Buffett Indicator (see the rightmost column of the graph below). Its critical value is 1 and, if it exceeds 1, the stock prices are regard as too high. It peaked at 1.64 during the 3rd quarter of 2021, and has declined below 1.2 since then. However, it stopped declining and has remained around 1.2 during the last two quarters. Now, the US economy faces the possibility of stagflation, a combination of stagnation and inflation. Although the stock market participants hope lowering the interest rates, the FED is saying that inflation is stubbornly high.

| Year | Quarter | Nominal GDP (red, left scale) | Wilshire5000 Index Quarterly mean (blue, right scale) | Wilshire5000 Index Fitted value (red, right scasle) | Wilshire5000 Index Q. mean÷F. value |
| 2021 | 1st | 22,314 | 194.3 | 120.1 | 1.604 |
| 2nd | 23,047 | 208.4 | 128.5 | 1.622 | |
| 3rd | 23,550 | 219.5 | 133.7 | 1.642 | |
| 4th | 24,349 | 227.4 | 142.2 | 1.599 | |
| 2022 | 1st | 24,740 | 216.2 | 146.4 | 1.477 |
| 2nd | 25,248 | 197.2 | 152.0 | 1.298 | |
| 3rd | 25,724 | 192.3 | 157.3 | 1.220 | |
| 4th | 26,138 | 186.5 | 162.4 | 1.145 | |
| 2023 | 1st | 26,466 | 194.6 | 166.1 | 1.171 |
| 2nd (April) | N/A | 199.3 | N/A | N/A |

