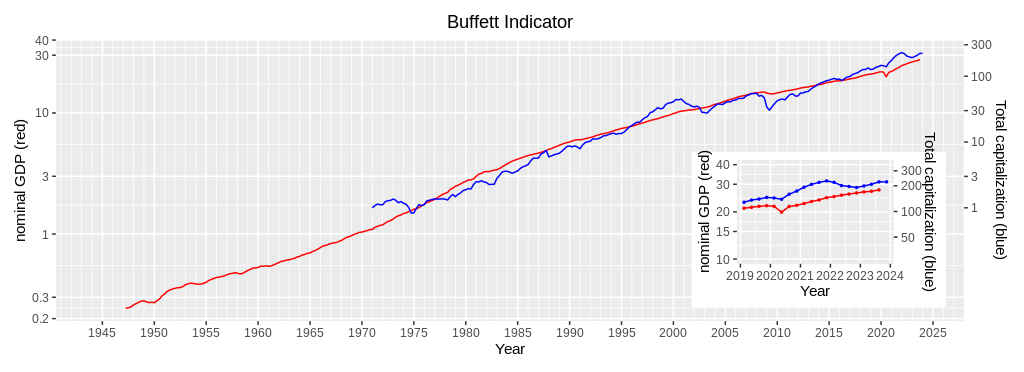
Updated Graph of Buffett Indicator (4th quarter, 2023)
The quarterly mean of the Wilshire 5000 index was $ 222.5 billion for the 4th quarter of 2023 which was the same level as the 3rd quarter. Probably, the nominal GDP of the 4th quarter would increase by a couple of percentages from the 3rd quarter. If that is the case, the quarterly mean would be about 20 percent above the fitted value which is estimated by the nominal GDP.

| Year | Quarter | Nominal GDP (red, left scale) | Wilshire5000 Index Quarterly mean (blue, right scale) | Wilshire5000 Index Fitted value (red, right scasle) | Wilshire5000 Index Q.mean÷F.value |
| 2021 | 1st | 22,600 | 192.7 | 123.7 | 1.557 |
| 2nd | 23,292 | 207.9 | 130.8 | 1.589 | |
| 3rd | 23,829 | 219.3 | 136.4 | 1.608 | |
| 4th | 24,655 | 228.2 | 145.3 | 1.571 | |
| 2022 | 1st | 25,029 | 219.6 | 149.3 | 1.470 |
| 2nd | 25,544 | 201.2 | 155.0 | 1.299 | |
| 3rd | 25,995 | 196.5 | 160.1 | 1.227 | |
| 4th | 26,408 | 190.8 | 164.8 | 1.157 | |
| 2023 | 1st | 26,814 | 199.2 | 169.5 | 1.175 |
| 2nd | 27,063 | 208.5 | 172.4 | 1.209 | |
| 3rd | 27,610 | 222.2 | 178.9 | 1.242 | |
| 4th | N/A | 222.5 | N/A | N/A |

