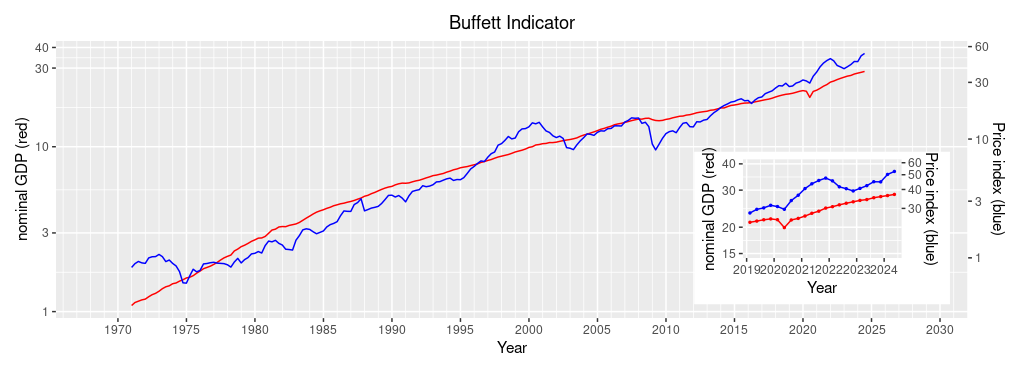
Report on Buffett Indicator (2nd Quarter, 2024)
New GDP data of the US has been published, recently. US nominal GDP grew by 1.3% from the 1st quarter of 2024, but the Wilshire 5000 index rose by 4.7% for the same period. As a result, the Buffett Indicator (the right-most column of the table below) increased by 0.032. Although the indicator increased from the previous quarter, the pace was down. The US economy shows signs of a slowdown, and so may the US stock markets.

| Year | Quarter | Nominal GDP (red, left scale) | Wilshire5000 Index Quarterly mean (blue, right scale) | Wilshire5000 Index Fitted value (red, right scasle) | Wilshire5000 Index Q.mean÷F.value |
| 2021 | 1st | 22,600 | 40,525 | 26,586 | 1.517 |
| 2nd | 23,292 | 43,581 | 27,720 | 1.564 | |
| 3rd | 23,829 | 45,026 | 28,609 | 1.594 | |
| 4th | 24,655 | 47,519 | 29,991 | 1.576 | |
| 2022 | 1st | 25,029 | 45,565 | 30,624 | 1.480 |
| 2nd | 25,544 | 41,627 | 31,500 | 1.315 | |
| 3rd | 25,995 | 40,448 | 32,272 | 1.247 | |
| 4th | 26,408 | 39,099 | 32,986 | 1.179 | |
| 2023 | 1st | 26,814 | 40,640 | 33,689 | 1.200 |
| 2nd | 27,063 | 42,370 | 34,123 | 1.235 | |
| 3rd | 27,610 | 44,978 | 35,083 | 1.275 | |
| 4th | 27.957 | 44,870 | 35,695 | 1.250 | |
| 2024 | 1st | 28,269 | 50,233 | 36,275 | 1.385 |
| 2nd | 28,629 | 52,570 | 37,092 | 1.417 |

