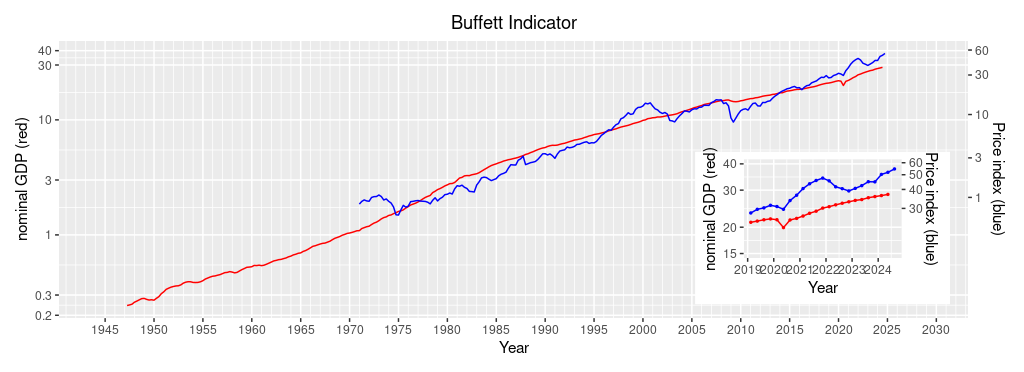
Updated Graph of Buffett Indicator (3rd quarter, 2024)
This page presents the updated graph of the Buffett Indicator for the US stock markets. The Buffett Indicator (the right-most column) has steadily increased since the 4th quarter of 2022. The index was 1.179, then. However, the index does not reach the previous peak in the 3rd quarter of 2021. The index was 1.594, then. This year, because the Wilshire 5000 Price Index rose by 5.2% in the 3nd quarter, the index will likely increase from 1.399 in the 2st quarter. A presidential election will be in the 4th quarter, so the stock price index will be uncertain. See what happens in the 4th quarter.

| Year | Quarter | Nominal GDP (red, left scale) | Wilshire 5000 Price Index Quarterly mean (blue, right scale) | Wilshire 5000 Price Index Fitted value (red, right scasle) | Wilshire 5000 Price Index Quarterly mean / Fitted value |
| 2021 | 1st | 22,600 | 40,525 | 26,710 | 1.517 |
| 2nd | 23,292 | 43,581 | 27,851 | 1.565 | |
| 3rd | 23,829 | 45,026 | 28,746 | 1.594 | |
| 4th | 24,655 | 47,519 | 30,137 | 1.577 | |
| 2022 | 1st | 25,029 | 45,565 | 30,775 | 1.481 |
| 2nd | 25,544 | 41,627 | 31,657 | 1.315 | |
| 3rd | 25,995 | 40,448 | 32,434 | 1.247 | |
| 4th | 26,408 | 39,099 | 33,153 | 1.179 | |
| 2023 | 1st | 26,814 | 40,640 | 33,861 | 1.200 |
| 2nd | 27,063 | 42,370 | 34,299 | 1.235 | |
| 3rd | 27,610 | 44,978 | 35,265 | 1.275 | |
| 4th | 27.957 | 44,870 | 35,881 | 1.251 | |
| 2024 | 1st | 28,269 | 50,233 | 36,439 | 1.379 |
| 2nd | 28,629 | 51,877 | 37,084 | 1.399 | |
| 3rd | N/A | 54,591 | N/A | N/A |

