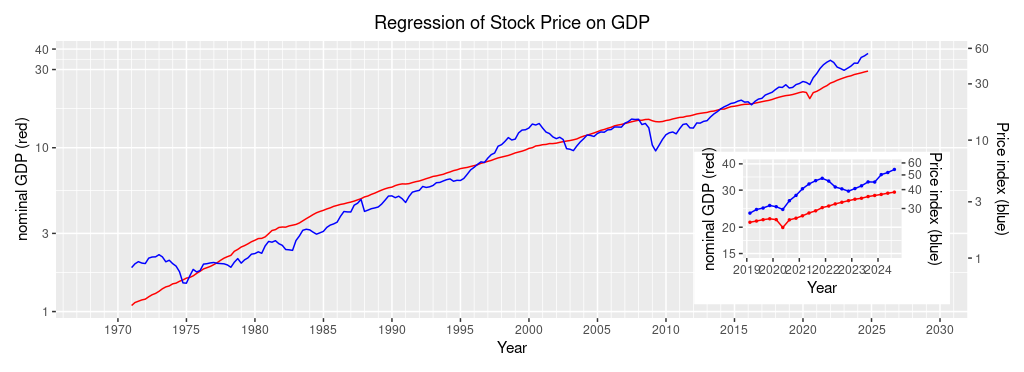
Report on Buffett Indicator (3rd Quarter, 2024)
New US GDP data has been recently published. US nominal GDP grew by 1.1% from the 2nd quarter of 2024, but the Wilshire 5000 index rose by 4.7% for the same period. As a result, the Buffett Indicator (the right-most column of the table below) increased by 0.043. The indicator not only increased from the previous quarter but also increased in pace. The US economy was showing a sign of a slowdown, but the US stock markets were speeding up.

| Year | Quarter | Nominal GDP (red, left scale) | Wilshire5000 Index Quarterly mean (blue, right scale) | Wilshire5000 Index Fitted value (red, right scasle) | Wilshire5000 Index Q.mean÷F.value |
| 2021 | 1st | 22,657 | 40,525 | 26,867 | 1.508 |
| 2nd | 23,369 | 43,581 | 28,047 | 1.554 | |
| 3rd | 23,922 | 45,026 | 28,974 | 1.582 | |
| 4th | 24,777 | 47,519 | 30,422 | 1.562 | |
| 2022 | 1st | 25,215 | 45,565 | 31,173 | 1.462 |
| 2nd | 25,806 | 41,627 | 32,191 | 1.293 | |
| 3rd | 26,272 | 40,448 | 33,002 | 1.225 | |
| 4th | 26,734 | 39,099 | 33,812 | 1.156 | |
| 2023 | 1st | 27,146 | 40,640 | 34,570 | 1.176 |
| 2nd | 27,454 | 42,370 | 35,082 | 1.208 | |
| 3rd | 27,968 | 44,978 | 35,998 | 1.249 | |
| 4th | 28,297 | 44,870 | 36,588 | 1.226 | |
| 2024 | 1st | 28,624 | 50,233 | 37,177 | 1.351 |
| 2nd | 29,017 | 51,877 | 37,888 | 1.369 | |
| 3rd | 29,350 | 54,340 | 38,493 | 1.412 |

