
Updated Graph of Buffett Indicator (2nd quarter, 2025)
This page presents the updated graph of the Buffett Indicator for the US stock markets. Trump tariffs have disturbed the global economy, and the Wilshire 5000 has declined by 5.6% since the previous quarter. But it seems to be recovering. Perhaps the global economy is adapting to Trump’s tariff policies.
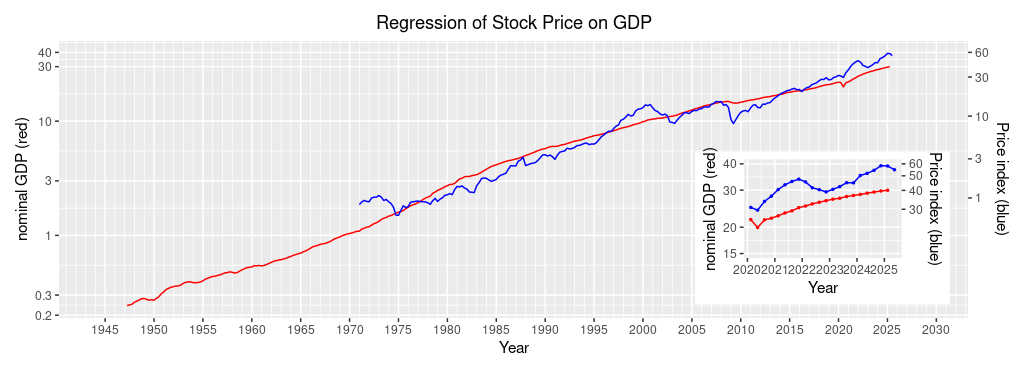
| Year | Quarter | Nominal GDP (red, left scale) | Wilshire 5000 Price Index Quarterly mean (blue, right scale) | Wilshire 5000 Price Index Fitted value (red, right scale) | Wilshire 5000 Price Index Quarterly mean / Fitted value |
| 2021 | 1st | 22,657 | 40,525 | 27,144 | 1.49 |
| 2nd | 23,369 | 43,581 | 28,341 | 1.54 | |
| 3rd | 23,922 | 45,826 | 29,282 | 1.57 | |
| 4th | 24,777 | 47,519 | 30,752 | 1.55 | |
| 2022 | 1st | 25,215 | 45,565 | 31,514 | 1.45 |
| 2nd | 25,806 | 41,627 | 32,549 | 1.29 | |
| 3rd | 26,272 | 40,448 | 33,372 | 1.21 | |
| 4th | 26,734 | 39,099 | 34,194 | 1.14 | |
| 2023 | 1st | 27,164 | 40640 | 34,964 | 1.16 |
| 2nd | 27,454 | 42,370 | 35,485 | 1.19 | |
| 3rd | 27,968 | 44,978 | 36,415 | 1.24 | |
| 4th | 28,297 | 44,870 | 37,015 | 1.21 | |
| 2024 | 1st | 28,624 | 50,233 | 37,614 | 1.34 |
| 2nd | 29,017 | 51,877 | 38,335 | 1.35 | |
| 3rd | 29,375 | 54,340 | 38,997 | 1.39 | |
| 4th | 29,724 | 58,277 | 39,645 | 1.47 | |
| 2025 | 1st | 29,962 | 58,061 | 40,089 | 1.45 |
| 2nd | N/A | 54,814 | N/A | N/A |