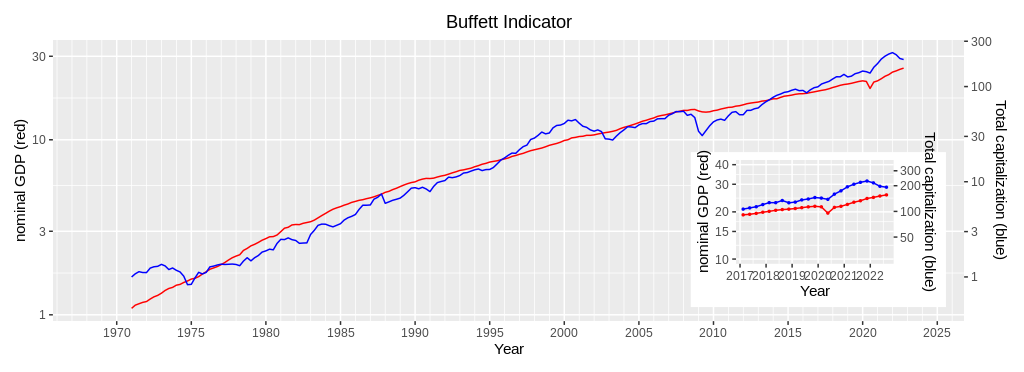
Report on Buffett Indicator (3rd quarter, 2022)
This page reports the Buffett Indicator up to the 3rd quarter of year 2022. Recently, US nominal GDP was reported. Even though real GDP increased at an annual rate of 2.6 % in the 3rd quarter, nominal GDP increased 6.7 % at an annual rate. On the other hand, the Wilshire 5000 Index had decreased in the same quarter. Consequently, the gap between nominal GDP and the Index shrank from 1.647 in the 4rh quarter of 2021 to 1.230 in the 3rd quarter of 2022. The gap seems shrinking faster in the 4th quarter of this year.
Now, US nominal GDP is increasing in 9 consecutive quarters, while the Wilshire 5000 Index is decreasing in 3 consecutive quarters. These trends seem to continue in a few next quarters due to high rates of interest and inflation.

| Year | Quarter | Nominal GDP (red, left scale) | Wilshire5000 Index Quarterly mean (blue, right scale) | Wilshire5000 Index Fitted value (red, right scasle) | Wilshire5000 Index Q.mean÷F.value |
| 2021 | 1st | 22,313 | 194.3 | 120.8 | 1.608 |
| 2nd | 23,046 | 208.4 | 128.2 | 1.626 | |
| 3rd | 23,550 | 219.5 | 133.4 | 1.645 | |
| 4th | 24,349 | 227.4 | 138.1 | 1.647 | |
| 2022 | 1st | 24,740 | 216.2 | 141.9 | 1.524 |
| 2nd | 25,248 | 197.2 | 151.7 | 1.300 | |
| 3rd | 25,663 | 192.3 | 156.3 | 1.230 | |
| 4th (October) | N/A | 180.8 | N/A | N/A |

