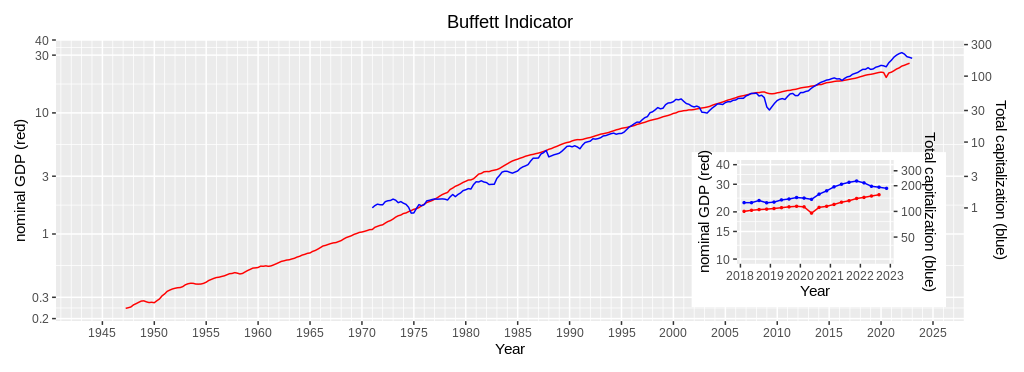
Updated Graph of Buffett Indicator (4th quarter, 2022)
This is the updated graph of the Buffett Indicator for the 4th quarter of year 2022. The Wilshire5000 Index had declined from 1.645 in the 3rd quarter of 2021 to 1.226 in the 3rd quarter of 2022. In the 4th quarter of 2022, the index was about 20% higher than the level corresponding to nominal GDP. The index kept declining, but its downward speed seemed slowing down. Hopefully, the index would reach its trough in a few quarters.

| Year | Quarter | Nominal GDP (red, left scale) | Wilshire5000 Index Quarterly mean (blue, right scale) | Wilshire5000 Index Fitted value (red, right scasle) | Wilshire5000 Index Q.mean÷F.value |
| 2021 | 1st | 22,314 | 194.3 | 120.8 | 1.608 |
| 2nd | 23,047 | 208.4 | 128.2 | 1.626 | |
| 3rd | 23,550 | 219.5 | 133.4 | 1.645 | |
| 4th | 24,349 | 227.4 | 141.9 | 1.603 | |
| 2022 | 1st | 24,740 | 216.2 | 146.1 | 1.480 |
| 2nd | 25,248 | 197.2 | 151.7 | 1.300 | |
| 3rd | 25,724 | 192.3 | 156.9 | 1.226 | |
| 4th | N/A | 186.5 | N/A | N/A |

