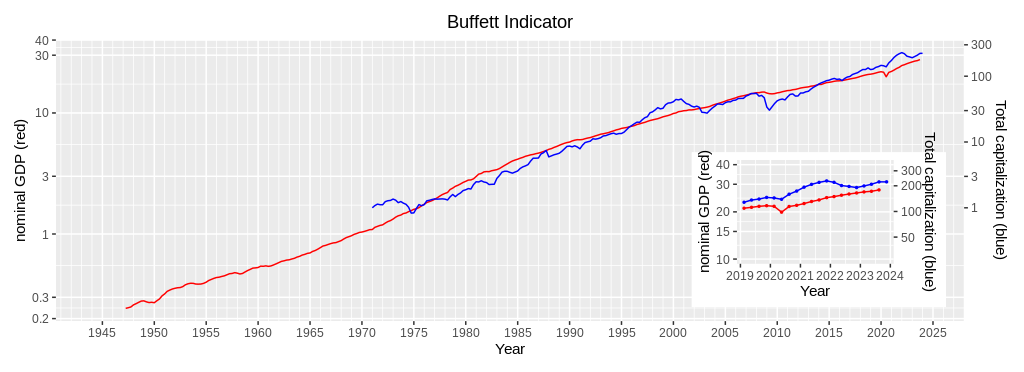
The above figure depicts both the Wilshire 5000 Total Market Full Cap Index and US nominal GDP. The figure shows that both curves are rising side by side, as the Buffett Indicator suggests. The Wilshire 5000 index, however, fluctuates more than GDP.
After World War II, the US experienced the post-war economic boom. The US along with other Western countries experienced unusually high economic growth with low unemployment. The Wilshire 5000 index was high above GDP. Low oil prices might have been one reason to sustain the boom. However, the 1973 oil-crisis terminated the boom, and the Wilshire 5000 index dropped below GDP. For twenty years between the mid-1970s and the mid-1990s, the Wilshire 5000 index remained just below GDP.
Around 1995, the dot-com boom hit the US economy and the index surged beyond GDP. The boom ended when the new millennium opened. The September 11 attacks and several accounting scandals also eroded investors’ confidence. The tide turned around in the mid-2000s, and the US housing bubble came next. It busted in the subprime mortgage crisis of 2006-2007. The following financial crisis of 2007-2008 hit hard the US financial markets. The Group of 20 came to rescue the world market.
The world economy including the US economy has been recovering since then. Even though the COVID-19 pandemic hit the world in 2020, the fiscal and monetary policies which many countries have employed prevent a possible economic plunge. Now, the Wilshire index stays high with a sizable gap over GDP. Possibly, we will see a plunge in the index in the foreseeable future.
